Supply Chain Emissions

Full Insights Into Your Supply Chain Emissions

Stay connected with all your supply chain emissions in one seamless system.

03 — Supply Chain
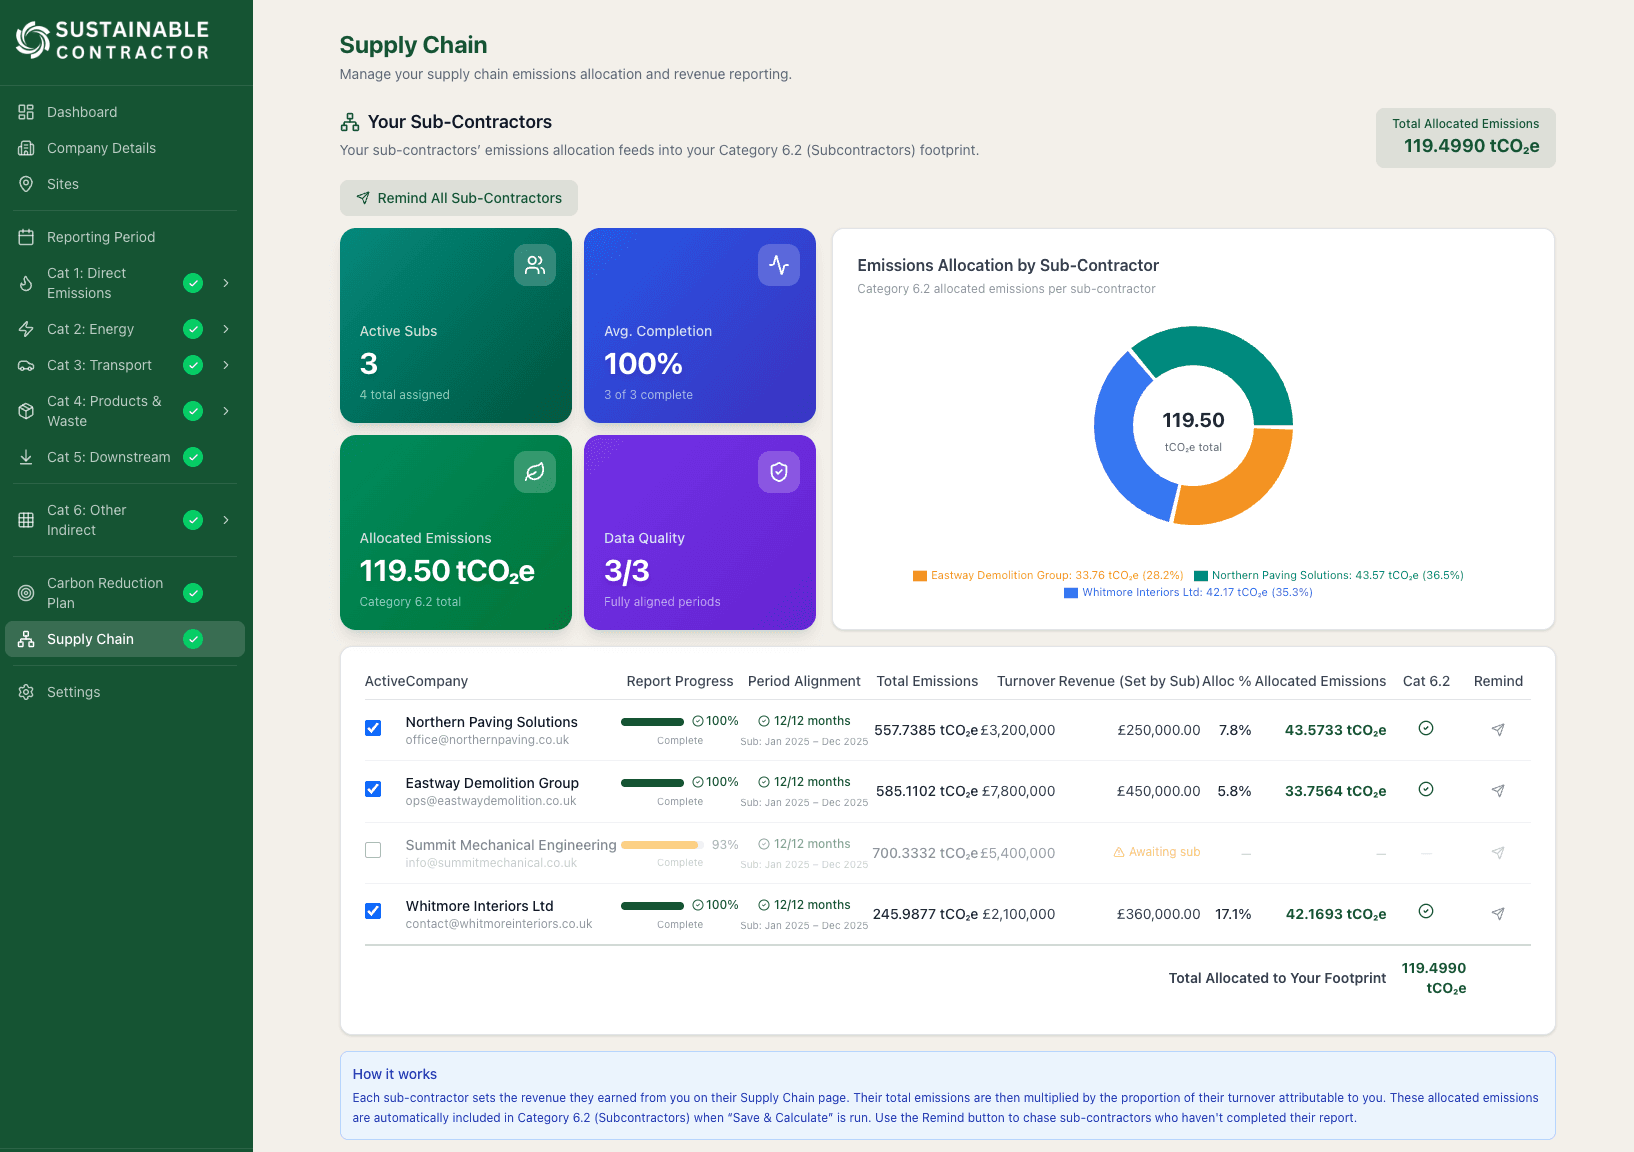
Supply Chain Management
Invite sub-contractors into your supply chain. Each sub gets their own dedicated account to report emissions data, which flows directly into your Scope 3 (Category 6) reporting. Full visibility across your entire supply chain.
  • Email invitations with one-click onboarding
  • Automated reminders when new reporting periods open
  • Revenue tracking — tCO₂e per £100k spend intensity
  • Submission tracking with drill-down to individual breakdowns
  • Emissions allocation automatically aggregates into Scope 3
app.../dashboard/supply-chain
Your Sub-Contractors
Total: 119.50 tCO₂e
3
Active Subs
100%
Avg. Completion
CONTRACTOR
PROGRESS
EMISSIONS
Northern Paving Solutions
43.6 tCO₂e
Eastway Demolition Group
33.8 tCO₂e
Summit Mechanical Eng.
Pending…


Why Spend Based Emissions Data


Why Spend Based Emissions Data

Does Not Wrok

Does Not Wrok

Interactive Demo

Scope 3: What Your Supply Chain Carbon Data Really Looks Like

When contractors don’t measure their emissions, you’re left estimating. As their revenue with you grows, so does your reported carbon — even if they’re actively decarbonising.

Spend-Based Estimate
830 t
CO₂e from sector averages
The Blind Spot
+479 t
overestimated vs reality
136% higher than actual
Supplier-Specific Data
351 t
CO₂e from verified reports
⚠️ Without Contractor Data

Using DEFRA spend-based factors. Scope 3 grows with spend regardless of actual performance.

Contractor
Spend
Scope 3
Bradshaw M&E
Mechanical & Electrical
£1.0m
270 t
Greenline Services
Environmental Services
£450k
99 t
Hartfield Building Co
General Construction
£800k
280 t
Cooper & Lane HVAC
Heating & Ventilation
£350k
109 t
Eastwood Electrical
Electrical Installations
£280k
73 t
Total Estimated830 tCO₂e
✅ With Sustainable Contractor

Each contractor completes a verified carbon report. Allocated by your share of their work.

Contractor
Actual
Scope 3
Bradshaw M&E
Mechanical & Electrical
390t total
125 t
Baseline carbon report completed
Greenline Services
Environmental Services
140t total
39 t
First emissions measurement
Hartfield Building Co
General Construction
520t total
114 t
Carbon baseline established
Cooper & Lane HVAC
Heating & Ventilation
165t total
41 t
Refrigerant leak audit completed
Eastwood Electrical
Electrical Installations
105t total
32 t
Energy audit completed
Total Verified351 tCO₂e
The Bottom Line

By Year 4, spend-based estimates show supply chain emissions increasing by 105% — even though every contractor is actively decarbonising. Actual supplier data shows a 25% reduction. One tells auditors you're going backwards. The other proves your strategy is working.

Ready to see your real Scope 3?
Get your contractors reporting actual emissions.
Learn More
Illustrative example using fictional companies. Spend-based factors representative of DEFRA SIC code ranges.

Flexible Plans Tailored for Every Business

The most comprehensive carbon reporting software designed with construction in mind.

Flexible Plans Tailored for Every Business

The most comprehensive carbon reporting software designed with construction in mind.

Flexible Plans Tailored for Every Business

The most comprehensive carbon reporting software designed with construction in mind.